In statistics, the mean squared error (MSE) is an important metric that measures the amount of error in a statistical model. It’s often used to assess the accuracy of a model that’s used to predict future values.
In this tutorial, we’ll explain what MSE is in more detail and then show you how to calculate MSE in Excel.
What Is Mean Squared Error?
The mean squared error (MSE) is a calculation that measures the average squared difference between estimated and actual values in a dataset. In other words, it estimates the amount of error in a statistical model. For the statistics geeks out there, it calculates how closely a regression line fits a set of data points.
For example, say you have a model that predicts the value of sales you’ll receive as a software company over a year. At the end of the year, you plug in the actual sales values that you generated. You can then calculate the MSE to see how well your model predicted the outcome.
MSE is calculated by taking the average of the squared differences between the predicted and actual values of the target variable.
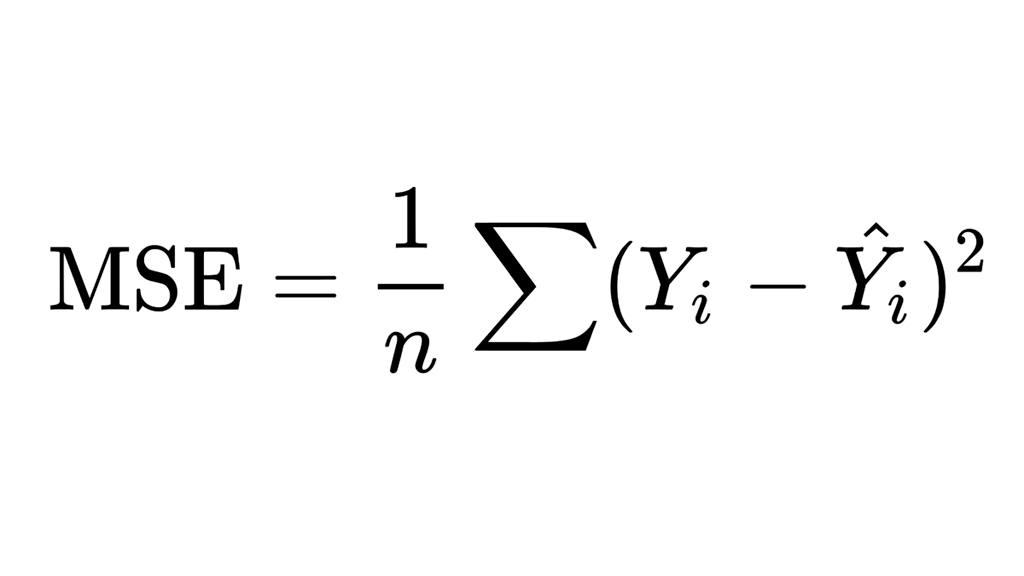
The MSE formula looks like this:
Where:
- Σ means the sum of values;
- n is the sample size or number of observations;
- Yi are the observed values, and;
- Ŷi are the predicted values.
A lower error value indicates that the model has a smaller standard error and is better at predicting the target variable. MSE is widely used in statistical regression and data analysis and can be helpful in comparing different models or tuning parameters to improve the accuracy of predictions.
This looks confusing, but it isn’t too hard to follow when we break it down in the following sections.
How to Calculate Mean Squared Error in Microsoft Excel
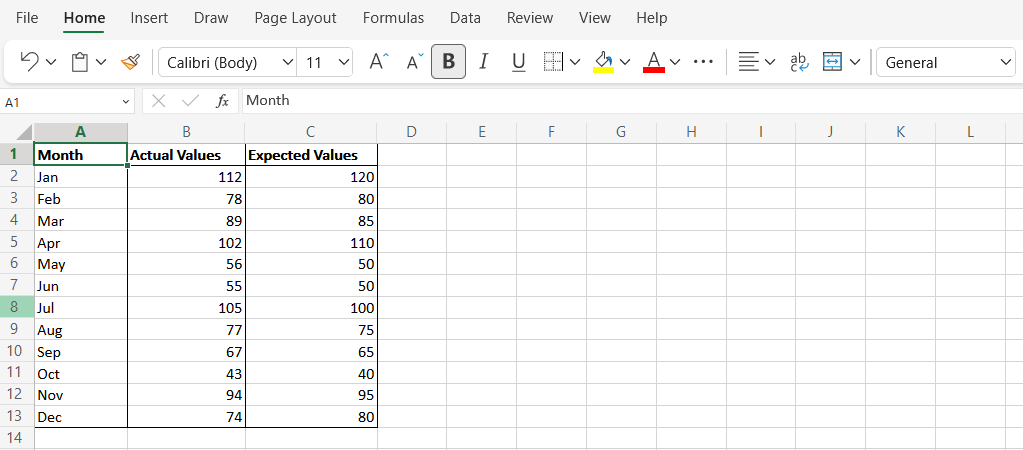
There are two main ways you can calculate MSE in Microsoft Excel: the SUMSQ function, the AVERAGE function, and the MSE formula. We’ll use the example below to show you how to calculate MSE using each of these functions:
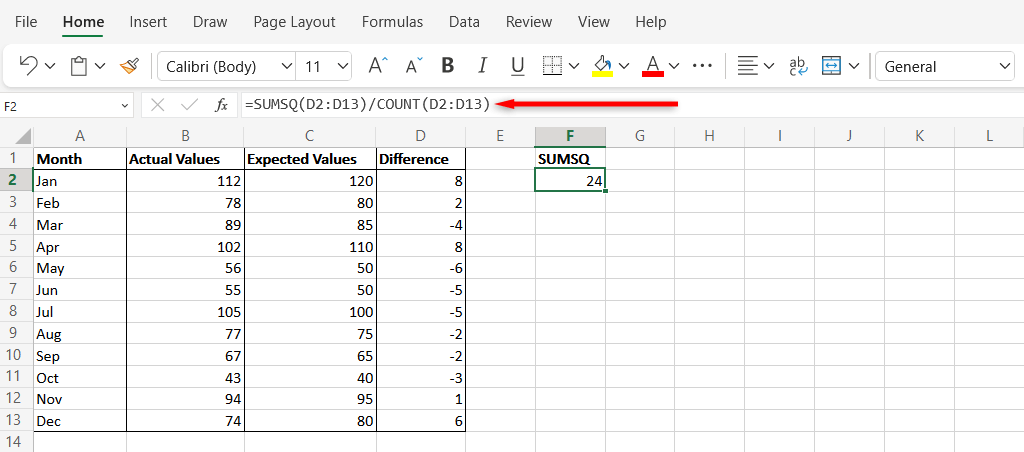
In this simplified example, we’ll look at fictional sales values for each month (Column A). The estimated values are represented in Column B and the actual values in Column C.
Calculate MSE Using the SUMSQ Function
The SUMSQ function in Excel is used to calculate the sum of the squares of numbers in a range. Here’s how to use it to calculate MSE:
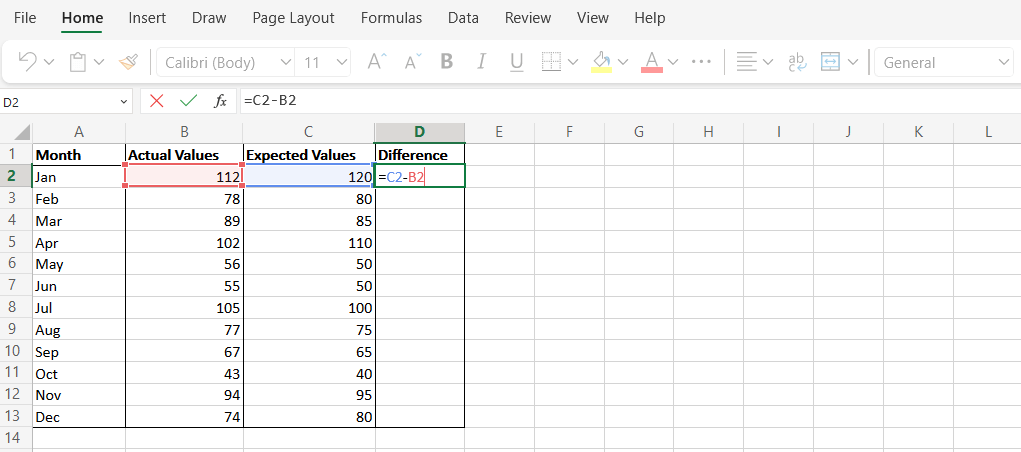
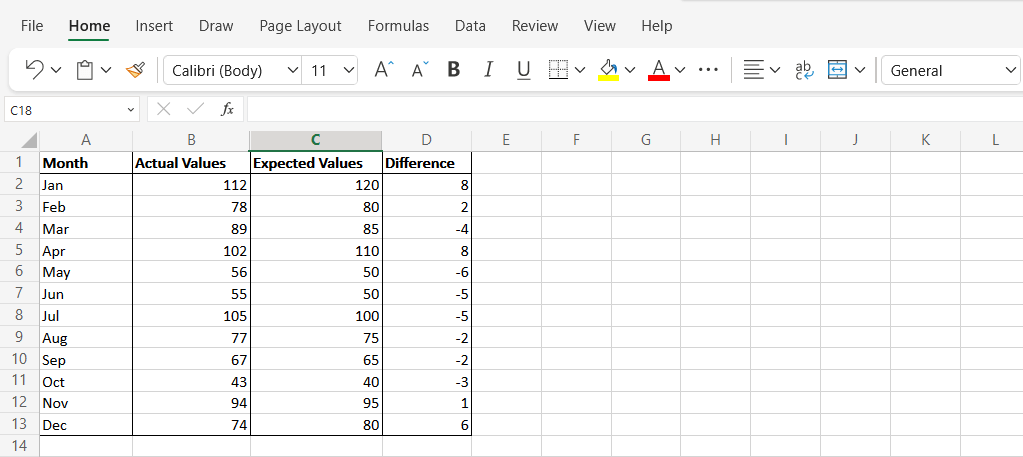
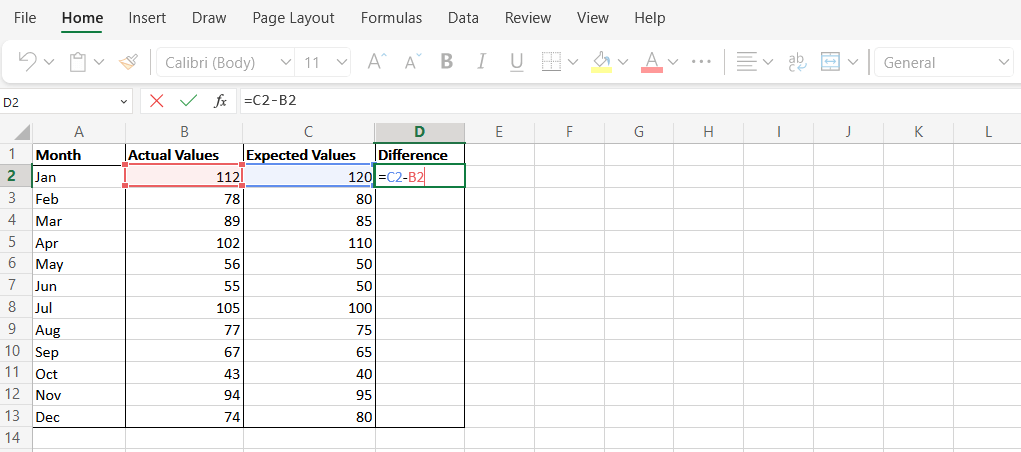
- Create a new column in Column D called “Difference”. This will represent the difference between the expected and actual values.
- Use the formula “C2-B2” to calculate the difference for the data points in each row.
- Select a new cell and type the following syntax: “=SUMSQ(D2:D13/COUNT(D2:D13)”. Replace the cells in the formula with the correct cells from your Excel spreadsheet. The final result in this cell is your MSE.
Calculate MSE Using the AVERAGE Function
The AVERAGE function in MS Excel is used to calculate the average of a range of numbers. This method returns the same result as the SUMSQ function, but each step is performed manually.
- Perform Steps 1 and 2 described in the SUMSQ method. This will return the differences between the forecasted values and actual data.
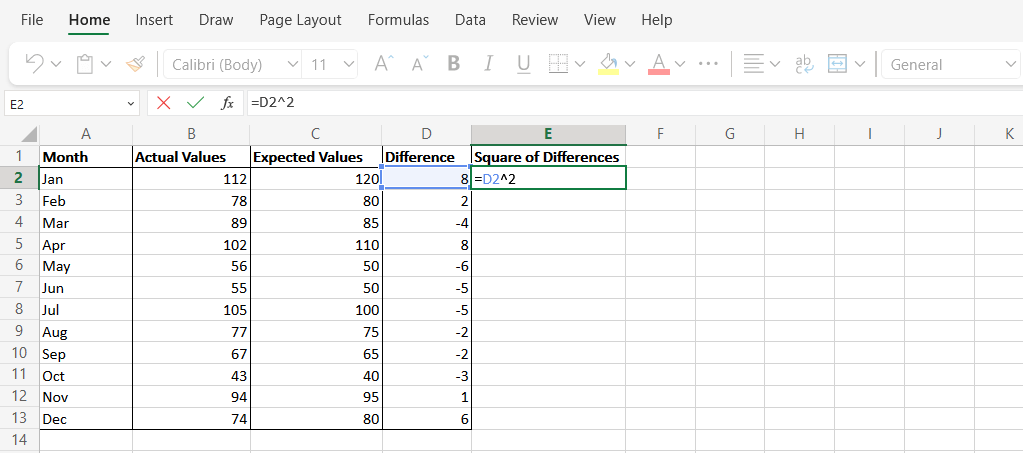
- Name Column E “Square of Differences”, then use the formula “=D2^2” to calculate the square of the difference of each value in Column D.
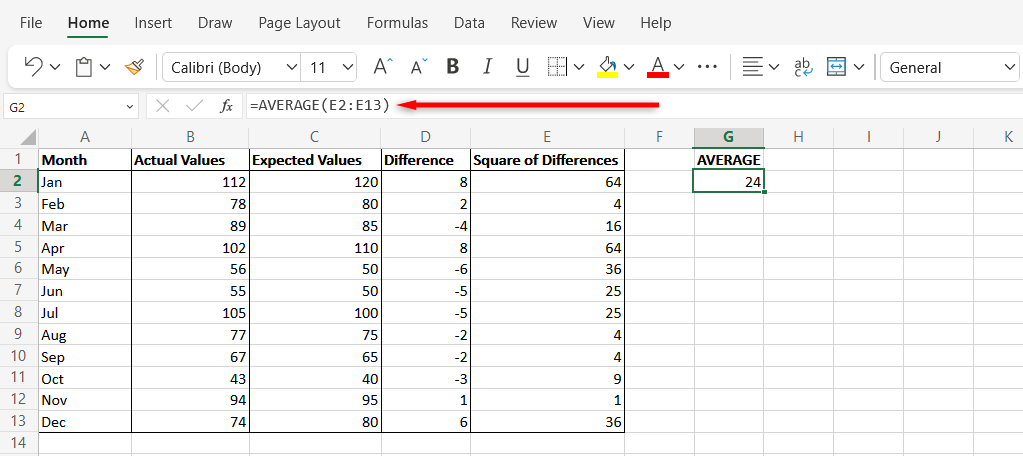
- Select a new cell and calculate the average value of Column E. This will return the mean of the squared values that you previously calculated. To do so, type “=AVERAGE(E2:E12)” and press Enter. Make sure to replace the cells with the cells you used in your worksheet. The resulting data value is your MSE.
Statistical Analysis in Microsoft Excel
Microsoft Excel has long been one of the most powerful tools for data analysis. Hopefully, with this tutorial, you can now use Excel to calculate MSE easily. And, since they’re so similar, you should be able to perform the same calculations in Google Sheets.


